Geophysical Data Factsheets
Magnetic Intensity
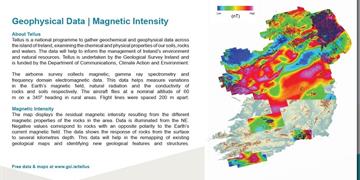
The map displays the residual magnetic intensity resulting from the different magnetic properties of the rocks in the area. Data is illuminated from the NE. Negative values correspond to rocks with an opposite polarity to the Earth’s current magnetic field. The data shows the response of rocks from the surface to several kilometres depth. This data will help in the remapping of existing geological maps and identifying new geological features and structures.
Apparent Resistivity
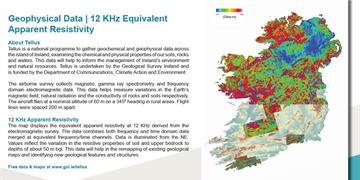
The map displays the equivalent apparent resistivity at 12 KHz derived from the electromagnetic survey. The data combines both frequency and time domain data merged at equivalent frequency/time channels. Data is illuminated from the NE. Values reflect the variation in the resistive properties of soil and upper bedrock to depths of about 50 m bgl. This data will help in the remapping of existing geological maps and identifying new geological features and structures.
Radiometric Ternary Image
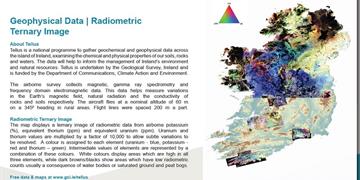
The map displays a ternary image of radiometric data from airborne potassium (%), equivalent thorium (ppm) and equivalent uranium (ppm). Uranium and thorium values are multiplied by a factor of 10,000 to allow subtle variations to be resolved. A colour is assigned to each element (uranium – blue, potassium – red and thorium – green). Intermediate values of elements are represented by a combination of these colours. White colours display areas which are high in all three elements, while dark browns/blacks show areas which have low radiometric counts usually a consequence of water bodies or saturated ground and peat bogs.