While traditional monitoring is an effective tool at priority sites, the distributed nature of groundwater flooding in karst lowlands hampers any systematic monitoring efforts. Floods tend to occur in isolated basins across the landscape and so would require an impractical amount of field monitoring to provide a complete picture. Earth Observation and Geographical Information System (GIS) approaches offer significant advantages in this respect. Passive satellite imagery, such as the USGS Landsat or ESA Copernicus Sentinel-2 programmes, can be used to image and delineate floods at a catchment scale. However, an obvious limitation of satellite systems that require a clear view of the earth's surface is the issue of cloud cover. When cloud cover is extensive, as is often the case in Ireland during winter floods, no useful data can be collected. Under these conditions active systems, such as Synthetic Aperture Radar (SAR), are extremely useful as they are not impacted by cloud cover (or time of day). In this context, the GWFlood project chose to use SAR imagery from the Copernicus Programme Sentinel-1 satellite constellation as its primary flood mapping tool.
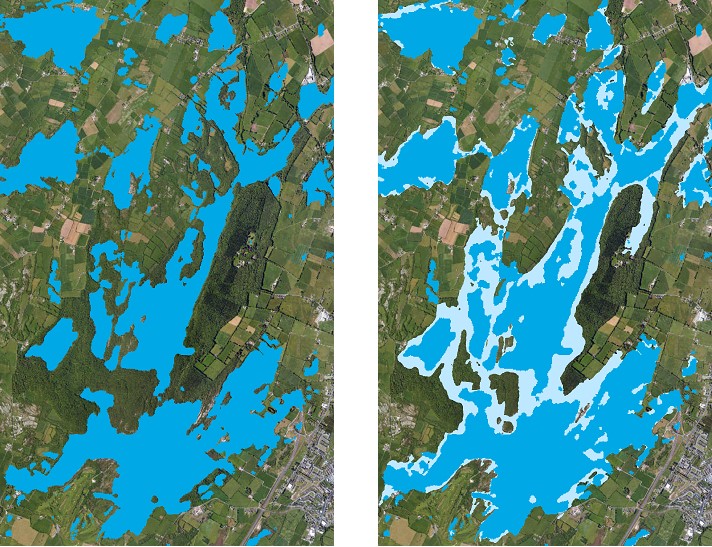
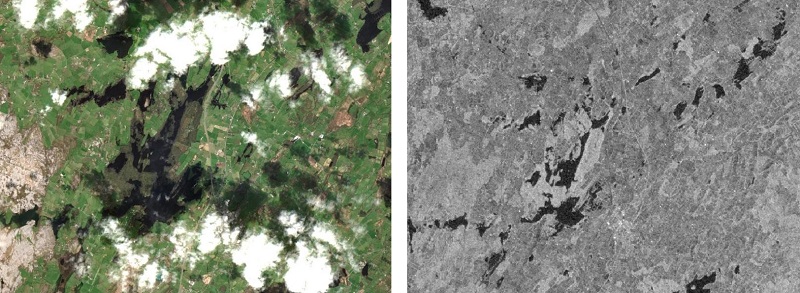 Comparison of Copernicus Sentinel-2 (left) and Sentinel-1 (right) imagery near Gort, Co. Galway in late March 2020. Sentinel-2 imagery is partially obscured by cloud while Sentinel-1 is unaffected. ©Copernicus data (2020).
Water delineation
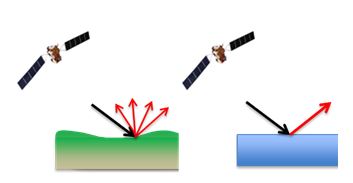
SAR systems emit radar pulses and record the return signal at the satellite. The strength of this signal, also called backscatter, is largely dependent on surface roughness and geometry. Flat surfaces such as water operate as reflectors resulting in minimal backscatter signal returning to the satellite. By exploiting this low backscatter characteristic of water, it is possible to delineate the extent of water bodies.
Water was delineated by looking at the histogram of the SAR images, and defining a threshold to differentiate between water and non-water. This approach was considered as it enabled an automated and repeatable process with minimal user interaction. The process involves the generation of a histogram of backscatter intensity values for predefined sections of the SAR image. The sections were selected focusing on regions with presence of permanent and temporary water. If the SAR image consists of both wet (i.e. low backscatter) and dry (i.e. high backscatter) pixels, the histogram should exhibit a bimodal distribution, with the peaks representing wet and dry pixels.
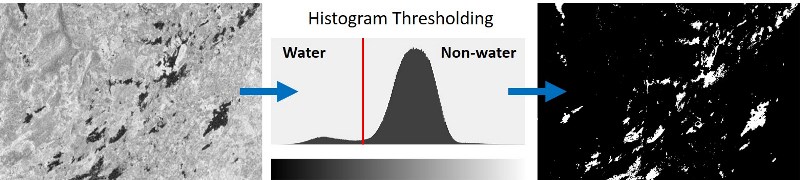
A threshold value between these peaks was then applied to separate the SAR image into a binary 'wet' and 'dry' image. The determination of the threshold value is not trivial as the wet and dry peaks (or curves) overlap to a certain extent. To account for this complexity, the GWFlood mapping procedure used two threshold determination approaches.
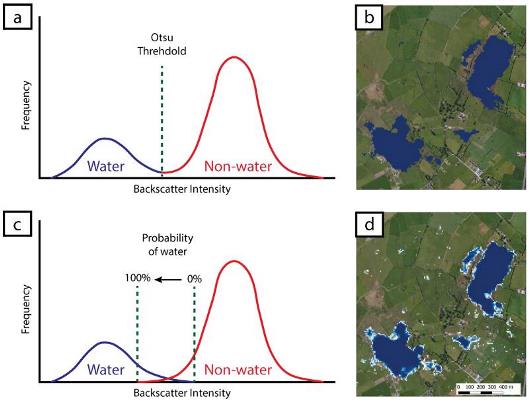
Thresholding Methodologies: (a) applying Otsu threshold to histogram, (b) Otsu thresholded SAR image, (c) applying probability threshold to histogram, showing the percentage likelihood of a pixel being water and (d) probability thresholded SAR image (pixel darkness represents probability of water). Background image ©DigitalGlobe, Inc.
An automated process was developed in which flood boundaries from thresholded and filtered SAR images were cross-referenced against topographic data to calculate the elevation of the land-water interface. This calculated flood elevation was then combined with topographic mapping to delineate a topographically corrected flood extent.
 Sentinel-1 derived flood extent (left) and topographically corrected flood extent (right). Background image ©DigitalGlobe, Inc.
Hydrograph generation using SAR
SAR generated hydrographs were computed by combining satellite derived flood extents with high resolution topographic mapping, which allowed us to extract water level information from each satellite image. In this context, the SAR mapping methodology was adapted to reconstruct hydrometric data from as many suitable locations as possible. This methodology enabled, for the first time, the collection of concurrent hydrometric data at over 300 turloughs in Ireland.
 SAR generated hydrographs were calculated at all suitable sites over the last five years, mapping how groundwater floods develop and recede at a previously unachievable scale. For example, see the video below for an animation of the area (extension) and stage (elevation of the surface of the flood) of groundwater floods in Ireland mapped using Copernicus Sentinel1 satellite images acquired between 2015 - 2020.
Mobile version: